 |
|||
|
|
|||
|
|
|||
| ||||||||||
|
|
 TM 9-2320-211-20-3-2
d. Analyzing the Chart.
(1) General. After reading charts all the time, tests show that the driver
takes charge of the economical operation of his truck. Charts show if the driver is
driving the truck properly or if he needs some driving instructions. The chart can
be figured out by reading the speed and engine rpm fields daily. The charts shown
in this section show good and bad driving habits.
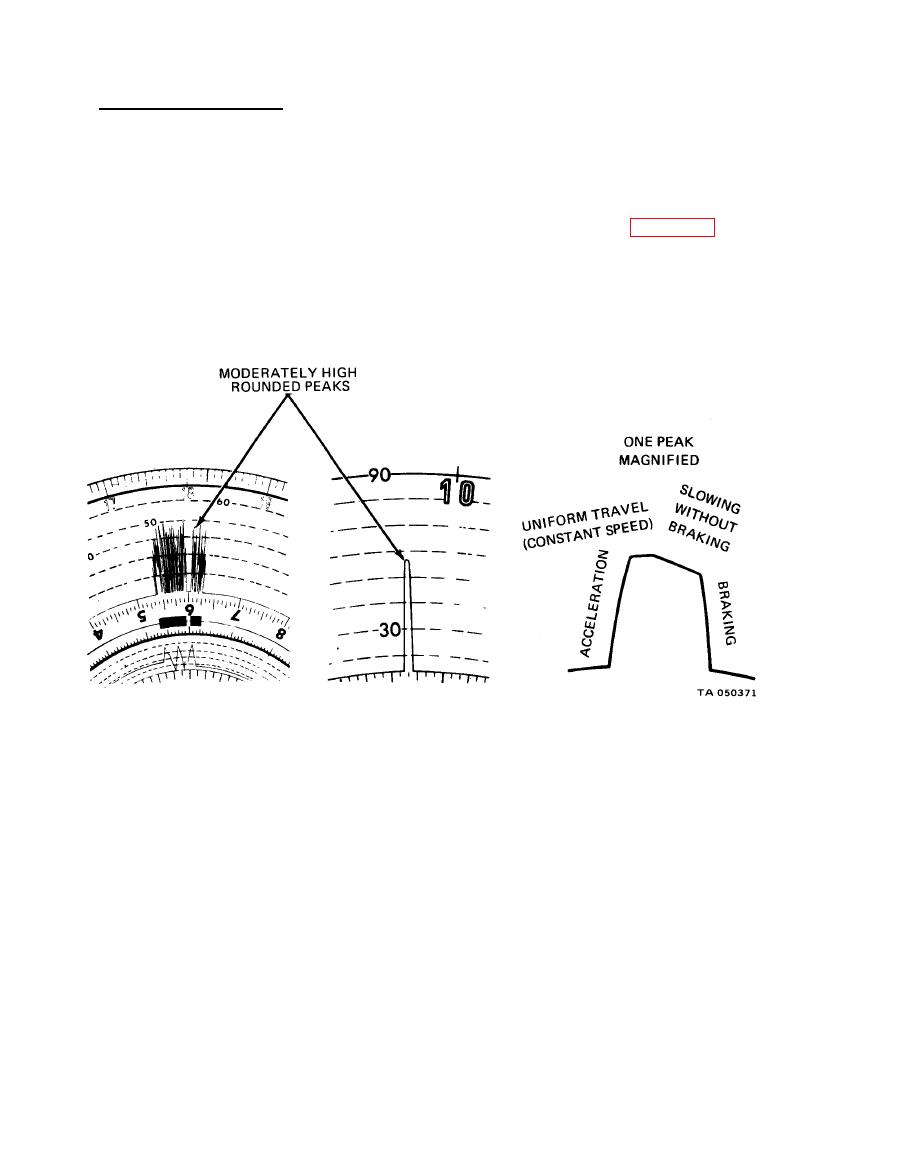
(2) Good driving speed chart. A good driving speed chart (Fig. 20-7) will
show uniform driving and average speeds. The closer the highest speed reading
comes to the average speed, the more uniform and economical the truck will be driven.
|
|
Privacy Statement - Press Release - Copyright Information. - Contact Us |
