 |
|||
|
|
|||
|
|
|||
| ||||||||||
|
|
 TM 9-2320-211-20-3-2
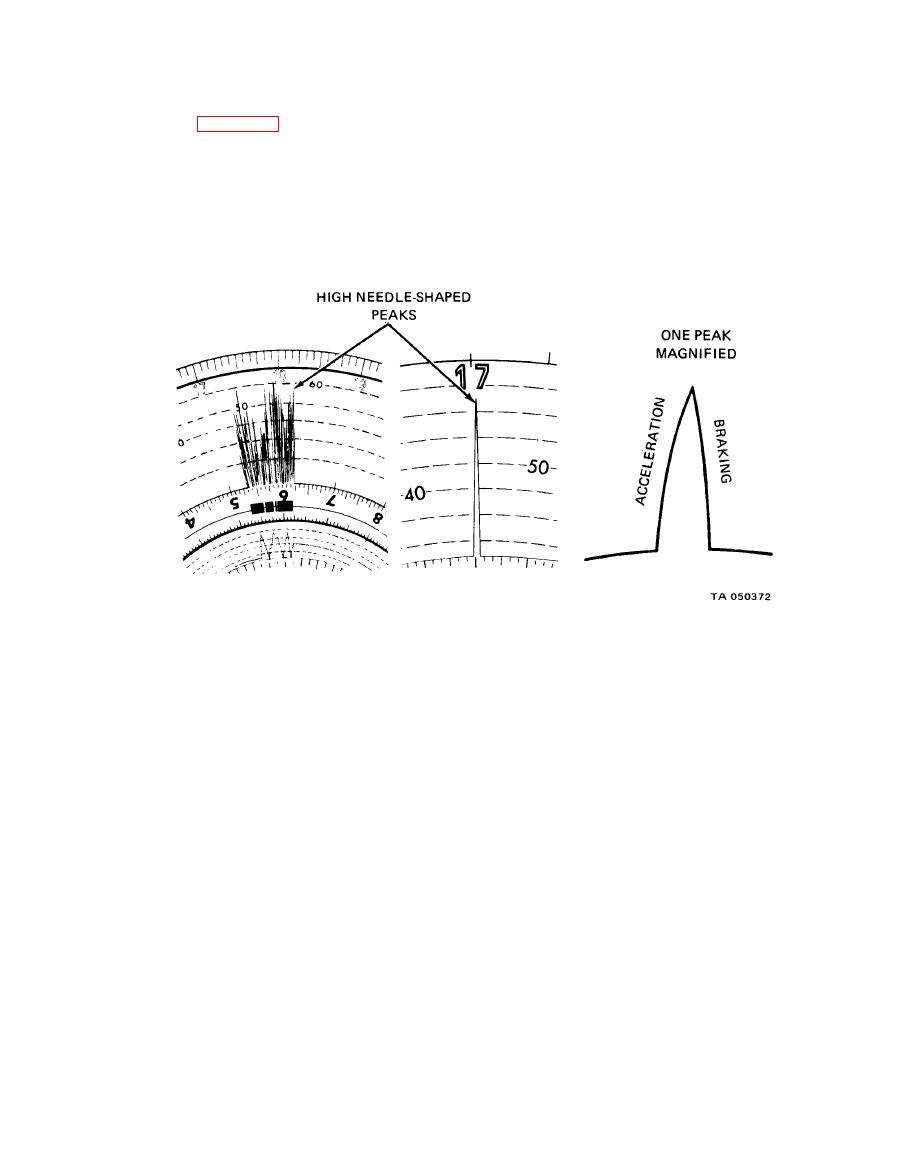
(3) Bad driving speed chart. High needle-shaped peaks in the vehicle
speed field (Fig. 20-8) show the truck was speeded up and then braked suddenly.
This is bad driving and is an important reason why the truck will not last long.
When reading charts, always think about road and traffic conditions.
Bad Driving Speed Chart
|
|
Privacy Statement - Press Release - Copyright Information. - Contact Us |
