 |
|||
|
|
|||
|
|
|||
| ||||||||||
|
|
 TM 9-2320-211-20-3-2
c.
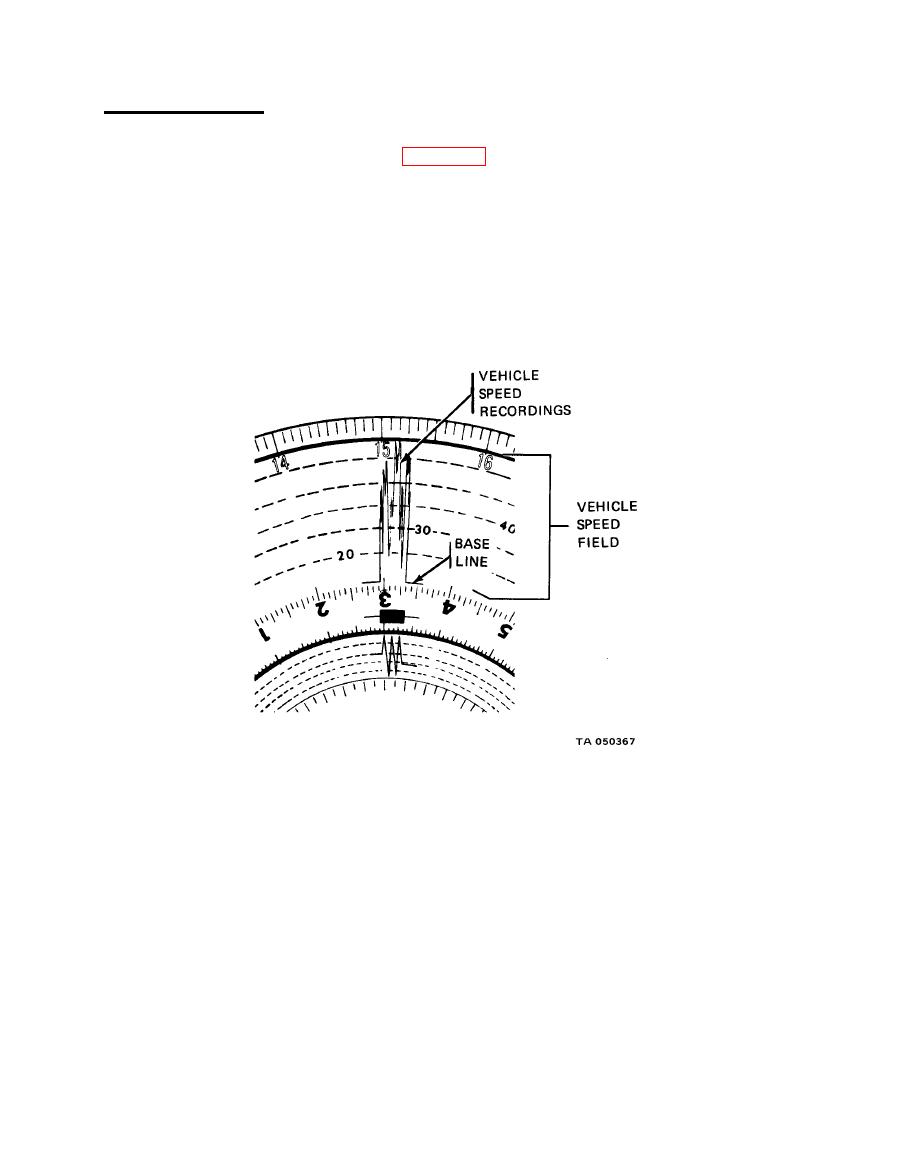
Reading of Chart.
(1) Vehicle speed field.
The speed field of the chart (Fig. 20-3) is divided by five circles. Each
circle is equal to ten miles an hour. When the truck goes faster, the speed recording
stylus moves up to show how fast the truck was driven. When the truck is stopped,
a base line is recorded. The base line will record just above the time scale as shown.
This line must run even with and above the inside time scale or the chart will not
show the right truck speed. If the base line is below the position shown, it is possi-
ble the stylus was bent down to show the truck was driven more slowly than it really
was.
Figure 20-3. Vehicle Speed Recordings
|
|
Privacy Statement - Press Release - Copyright Information. - Contact Us |
